The Year the Fever Broke
“If something cannot go on forever, it will stop.” — Herb Stein
It has been a while. Mea culpa. I’ve been writing for a friend’s hedge fund. That has distracted me. This is as good a time as any to get back to what I should be doing, organizing my thoughts, writing them down and transmitting them onward into the ether, er, to you, my loyal subscribers.
Last year, 2022, appears to have been a transition year for markets. Trends that lasted far longer than they ought, in my opinion, seem to have met their Lethe.
One trend in particular that has concerned me for the last several years has been the concentration of US equity returns in growth stocks. You know it’s a thing when they come up with an acronym for it and design products for that Procrustean bed. Perhaps you remember BRICS? That didn’t end well. Now we have to contend with FANG.
In the beginning there was FANG: Facebook, Apple, Netflix, Google. FANG begat FANG+ and other incarnations. Then they designed a FANG+ index, FANG+ futures and sundry FANG+ETFs. The New York Stock Exchange (NYSE) has a chart of a back test showing the wondrous performance of their FANG+ index from September 2014 through November 2022. It’s a rocket ship…until it isn’t.
Source: ICE NYSE
The best part, whether it came via careful curation or by ironic happenstance, is when the backtest begins, September 2014. It is conveniently timed to correspond to when tech stocks finally recovered from the bear market at the turn of the millennium. That occurred in November 2014 when QQQ, the ETF that proxies the NASDAQ-100, reattained its March 2000 peak.
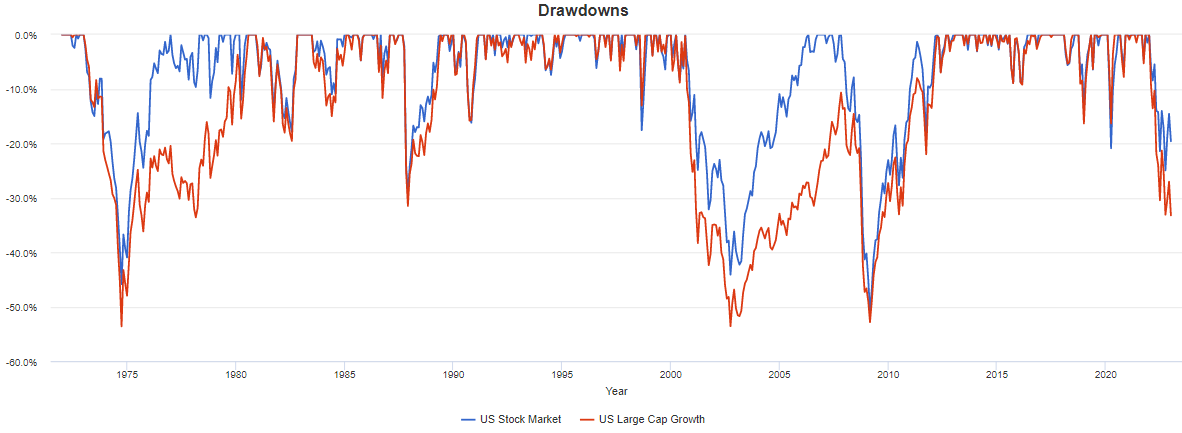
The chart above and those below show drawdowns. Drawdowns measure the amount an asset or investment strategy falls from a designated peak to a trough. In the chart above, the beginning peak is the height of the tech bull market in March 2000. Apart from the depth of the drawdown, the other key measure is the time to recovery, discussed in the accompanying paragraphs.
If you prefer going solely by tech performance, then XLK, the tech sector ETF from SPDR, did not recover until December 2016. Long hibernations those. For the sake of closure: The S&P 500 recovered by November 2006, a full decade before tech did.
Once again, a tech/growth stock drawdown is driving overall market performance. The damage is not nearly what it was in the 2000-2002 tech wreck unless you were excessively aggressive. See: Wood, Cathie.
Her ARKK is invested in many unprofitable firms, so it does resemble the largely profitless internet bubble. The FANG+ companies have been profitable for the most part; it’s their valuations that got out of whack. Trees do not grow to the sky, to paraphrase Herb Simon.
Nor do you need to recover your losses in the investments that drove them. Waiting for recovery in the same asset class/sector/industry/stocks that you were invested in when the market broke down can be a fool’s errand. The number of incidents is small but the record is stark, growth stocks have taken longer to recover from drawdowns than the broad market has in the last fifty years. If their derating continues, your portfolio is likely to be better off invested in the broad market than in growth. Or, perhaps, in value, but that is not today’s subject.


